
Abstract
We study the relationship between ICO proceeds (Total Raised) and current market capitalization (MCAP) for 400+ tokens. In log–log space we find a statistically significant but sub-linear association with slope (a\approx0.38) and (R^2=0.1602) on the full sample. We introduce a screening metric—the residual (r)—that measures how far a token’s MCAP sits above/below a cohort-adjusted “fair value” implied by raised capital. We also run cohort regressions by TGE year (“vintage”) and market regime (ICO boom, bear, bull, recent) and show that the residual is most informative for vintages 2019–2020 and 2023–Recent.
1. Data and Method
Universe. 400+ tokens with Project, Total Raised, Market Cap, and TGE Date.
Model. We fit the log–log regression
Model. We fit the log–log regression

The fitted line defines a fair capitalization:
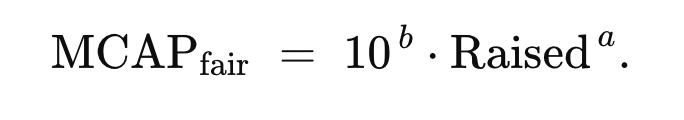
The residual (our screening score) is
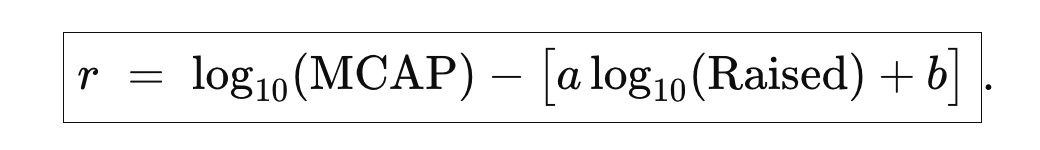
Interpretation: (r=0) → priced like peers for the same Raised;
(r<0) → cheap vs. peers (value candidate);
(r>0) → expensive vs. peers (quality/momentum candidate if adoption is rising).
Conveniently, 10^r = MCAP}/MCAPfair:
0.30 dex ≈ ×2, 0.70 dex ≈ ×5, 1.0 dex = ×10.
(r<0) → cheap vs. peers (value candidate);
(r>0) → expensive vs. peers (quality/momentum candidate if adoption is rising).
Conveniently, 10^r = MCAP}/MCAPfair:
0.30 dex ≈ ×2, 0.70 dex ≈ ×5, 1.0 dex = ×10.
Cohorts. We repeat the regression by TGE vintage and by market regime and compute cohort-specific ((a_v,b_v)), (R^2). This mitigates regime drift (tokenomics, listing practices, narrative cycles) and makes (r) comparable within a generation of launches.
2. Results
2.1 Global relation and dispersion
- The global fit is sub-linear (slope (\approx0.38)): doubling Raised implies only ~×1.3 higher fair MCAP.
- (R^2=0.1602): Raised explains a meaningful but limited share of cross-sectional variance—consistent with the idea that other drivers (float, unlocks, liquidity, on-chain usage, revenues) matter a lot.
- Dispersion is huge at any Raised level: for the same Raised we observe both (<1\times) and (>100\times) outcomes relative to Raised.
2.2 MCAP/Raised multiple vs. size of Raised
On a separate plot of MCAP/Raised against Raised, the multiple declines with size: very large raises tend to deliver lower capital efficiency ex post. This is consistent with high initial FDV, heavy unlock schedules, and slower product/market validation.
2.3 Cohort (vintage) evidence
- 2019–2020 and 2023–Recent vintages show higher (R^2) and healthier slopes than 2021–2022 (bull-phase cohort where (R^2) is low and the slope flattens).
- Interpretation: during bull cohorts many listings arrived with stretched FDVs and complex vesting, weakening the Raised→MCAP link; in more disciplined cohorts the link is clearer and residuals are more informative.
3. The Residual as a Practical Screening Metric
- Use global r to rank cross-sectionally; prefer cohort-specific (r_v) (computed with ((a_v,b_v))) for decisions within a vintage/sector.
- Portfolio construction naturally splits into two sleeves:
(ii) Value/Mean-reversion: (r\ll0) + rising adoption + low near-term dilution and sufficient liquidity.
4. High-residual leaders (examples)
Below are projects with high positive r (quality layer). The number in parentheses is (10^{r}) — the multiple of current MCAP vs. cohort-implied fair value.
- BNB (×448), XRP (×306), SOL (×167), ADA (×107), TRX (×92), XLM (×93), LINK (×40), BGB (×44), OKB (×26), TKX (×20), CAKE (×19), AVAX (×16), DOT (×16), ONDO (×15), TON (×14), ENS (×13), RNDR (×13), HBAR (×25), SUI (×23).
Notes.
- Exchange tokens (BNB, OKB, BGB, TKX) belong to a distinct bucket: buybacks/burns and exchange economics make them structurally high-r versus ICO coins—compare within their class.
- L1/L0 leaders (SOL, ADA, TRX, XRP, XLM, DOT, AVAX, TON, SUI, HBAR) exhibit durable network effects; high r reflects sustained adoption rather than “cheapness.”
- Infra/utility standouts (LINK, ENS, RNDR, ONDO, CAKE) owe high r to clear product–market fit (or, for DEX tokens, supportive tokenomics).
5. Portfolio Implications
Selection rules (actionable):
- Quality sleeve. Prefer (r\ge 0.7) (≈×5) and positive 90-day momentum in on-chain activity/fees/TVL, with UnlockPressure(_{90d}) ≤ 8–10% of MCAP and daily “clean” volume (\ge $3–5M).
- Value sleeve. Hunt (r\le -0.30) (≈≤×0.5) within the same vintage and sector, but only where on-chain metrics are inflecting up and near-term dilution is contained.
- Regime awareness. For 2021–2022 vintage, require tighter filters (e.g., (r\le -0.40) + unlock pressure (≤6–8%)) given low explanatory power in that cohort.
- Sizing. Use a composite score: ValueGap (= (-r_v)), Unlock risk (lower is better), Adoption momentum, Liquidity quality. Allocate weight proportionally to the score, cap single-name risk by liquidity and unlock schedule.
6. When ICO Proceeds Help Most
ICO proceeds are a useful but weak standalone predictor; their main value is to produce a benchmark fair value and a residual that flags statistical anomalies. Predictive power improves when you:
- compute cohort-specific models (vintage × sector),
- add float/unlock variables and on-chain fundamentals (active users, TVL, fees, revenues),
- filter by liquidity/market quality.
7. Limitations
- Survivorship bias: delisted/failed projects under-represented will overstate “efficiency.”
- Raised data quality: inconsistent definitions (seed/private vs. public sale) and missing vesting detail can blur signals.
- Tokenomics drift: emissions, fee sharing, buybacks change the MCAP–Raised mapping over time.
Conclusion
ICO proceeds provide a disciplined baseline for fair-value estimation; the residual (r) transforms that baseline into an actionable screening factor. In today’s environment, the best risk-adjusted opportunities cluster in 2019–2020 and 2023–Recent vintages, where the Raised→MCAP relation is more stable and residuals carry more information. Use high-r names as quality core when fundamentals confirm, and mine low-r names for value only where adoption and token-supply dynamics support mean reversion.