
Abstract
We present a cross-sectional valuation framework that estimates a cryptocurrency’s “fair” market capitalization from publicly available social and market signals. Two supervised models—(i) Gradient Boosting Regressor (GBR) and (ii) LightGBM with a Tweedie objective—are trained on engagement metrics (TwitterScore.io, watchlists, website traffic, Telegram) and liquidity (24h trading volume). The target and skewed predictors are log-transformed. Across repeated data pulls, both models explain ≈50% of the variation in log10(market cap), enabling a practical ranking of undervalued assets—coins with strong engagement but disproportionately low capitalization. We discuss limitations (e.g., zombie projects, inorganic activity) and outline improvements grounded in recent research (momentum filters, survival risk, on-chain fundamentals, and time-series modeling).
1. Introduction
Crypto assets lack traditional cash-flow anchors; instead, network size, attention, and liquidity play an outsized role in pricing. This study builds a mapping from observable engagement signals to a coin’s cross-sectional “fair” market capitalization. Comparing model-implied fair value to observed capitalization reveals potential mispricings that support data-driven portfolio rebalancing: we target undervalued coins—those with strong social metrics and relatively low market cap.
2. Data and Feature Engineering
We compile, per asset, the following predictors aligned to a market-cap snapshot:
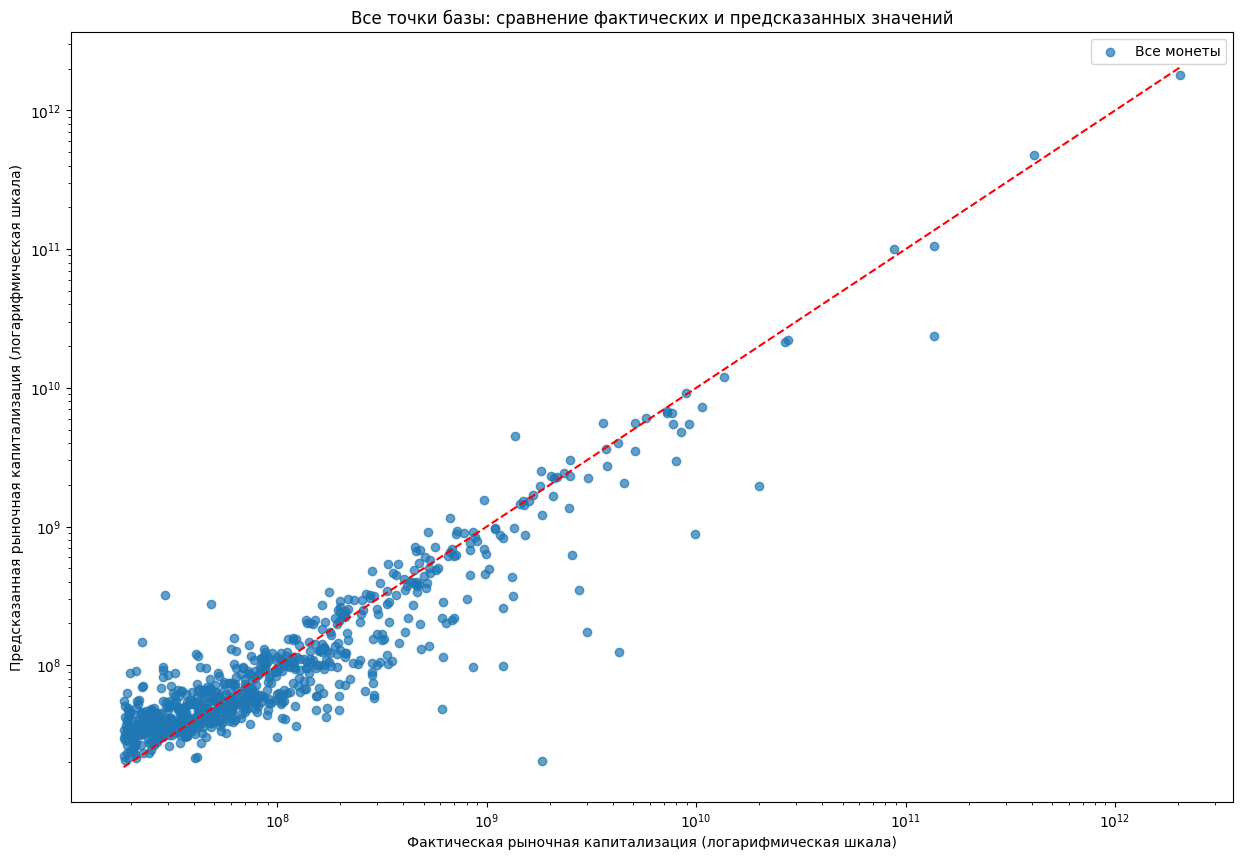
Each model yields a scatter of Actual vs. Predicted log-market-cap, with most coins clustered around the diagonal. Key summary statistics include the coefficient of determination R2 and RMSE; we also compute the adjusted R2 to account for the number of predictors, using.
- Twitter Score: a composite metric from TwitterScore.io that measures a project’s presence on Twitter. This score aggregates several Twitter-related factors – the number of followers, the level of engagement (likes, retweets, replies), the frequency of tweets about the project, and the reach of those tweets – into a single score. A higher Twitter Score indicates a large and active Twitter community around the coin.
- Follow/Watchlist Count: the number of users actively “following” the coin or adding it to watchlists on investment platforms. This reflects direct investor interest (akin to stock watchlists) – for example, the count of CoinMarketCap users who have the coin on their watchlist.
- Website Traffic (Hypestat): web engagement metrics for the project’s official website, specifically the average number of daily visitors and page impressions (sourced via Hypestat). These indicate the level of interest in the project’s online presence beyond social media.
- Trading Volume: the coin’s recent trading volume (e.g., 24-hour volume in USD). While not a social metric, volume is a measure of market activity and liquidity, included for comparison to see if social metrics add predictive power beyond what active trading alone would suggest.
- Telegram Community Size: the number of subscribers in the project’s official Telegram channel (a common platform for crypto communities). This serves as another proxy for community size and engagement outside of Twitter.
Each model yields a scatter of Actual vs. Predicted log-market-cap, with most coins clustered around the diagonal. Key summary statistics include the coefficient of determination R2 and RMSE; we also compute the adjusted R2 to account for the number of predictors, using.

where n is sample size and p the number of features. In what follows we report R2 , RMSE, and R2 for each model, as well as each feature’s univariate correlation with the (log) market cap.
Transformations:
• log1p(x) = ln(1 + x) for skewed predictors (all except Twitter Score)
• log10_cap = log10(market_cap_num)
These transforms stabilize variance and linearize elasticities typical of heavy-tailed financial data.
Transformations:
• log1p(x) = ln(1 + x) for skewed predictors (all except Twitter Score)
• log10_cap = log10(market_cap_num)
These transforms stabilize variance and linearize elasticities typical of heavy-tailed financial data.
3. Methods
Model 1 — GradientBoostingRegressor (GBR): 200 estimators, max_depth=3, random_state=42; train/test split 80/20; diagnostics include univariate fits, VIF checks, learning curves, and residual analysis.
Model 2 — LightGBM (Tweedie): objective=Tweedie (variance power=1.7), learning_rate=0.05, num_leaves=31, feature_fraction=0.8, bagging_fraction=0.8, n_estimators=500, random_state=42; evaluated on a test set and via 5-fold cross-validation.
Model 2 — LightGBM (Tweedie): objective=Tweedie (variance power=1.7), learning_rate=0.05, num_leaves=31, feature_fraction=0.8, bagging_fraction=0.8, n_estimators=500, random_state=42; evaluated on a test set and via 5-fold cross-validation.
4. Results
4.1 GradientBoostingRegressor (GBR)
Test metrics (log10 target): R² = 0.5221; Adjusted R² = 0.5034; RMSE = 0.4539; MAE = 0.3534.
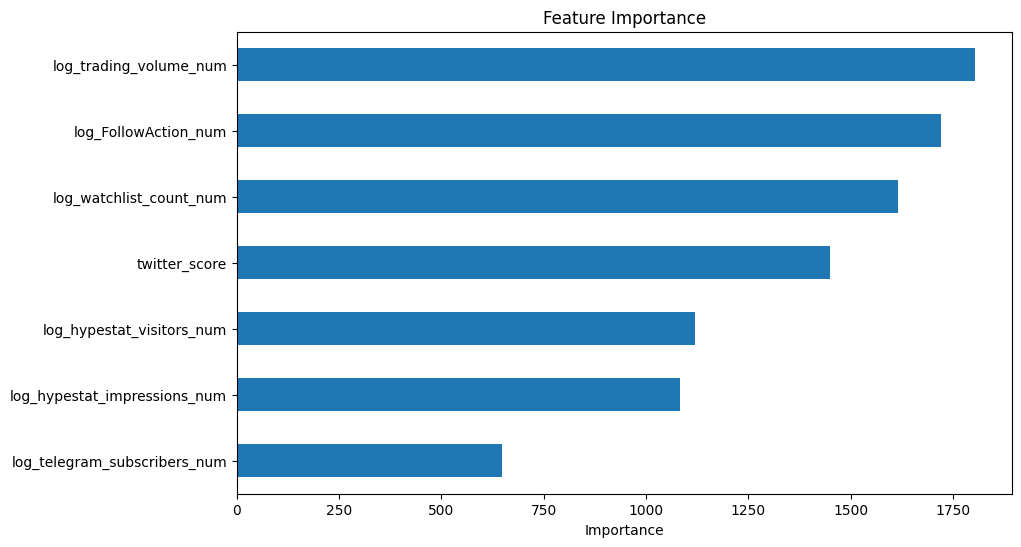
Standalone (one-feature) R² on the same train/test split: log_trading_volume_num = 0.2850; twitter_score = 0.1452; log_FollowAction_num = 0.1383; log_watchlist_count_num = 0.0164; log_hypestat_combined = -0.0439; log_telegram_subscribers_num = -0.2162. Implication: no single signal suffices; the multivariate bundle carries explanatory power.
Test metrics (log10 target): R² = 0.5221; Adjusted R² = 0.5034; RMSE = 0.4539; MAE = 0.3534.
Standalone (one-feature) R² on the same train/test split: log_trading_volume_num = 0.2850; twitter_score = 0.1452; log_FollowAction_num = 0.1383; log_watchlist_count_num = 0.0164; log_hypestat_combined = -0.0439; log_telegram_subscribers_num = -0.2162. Implication: no single signal suffices; the multivariate bundle carries explanatory power.
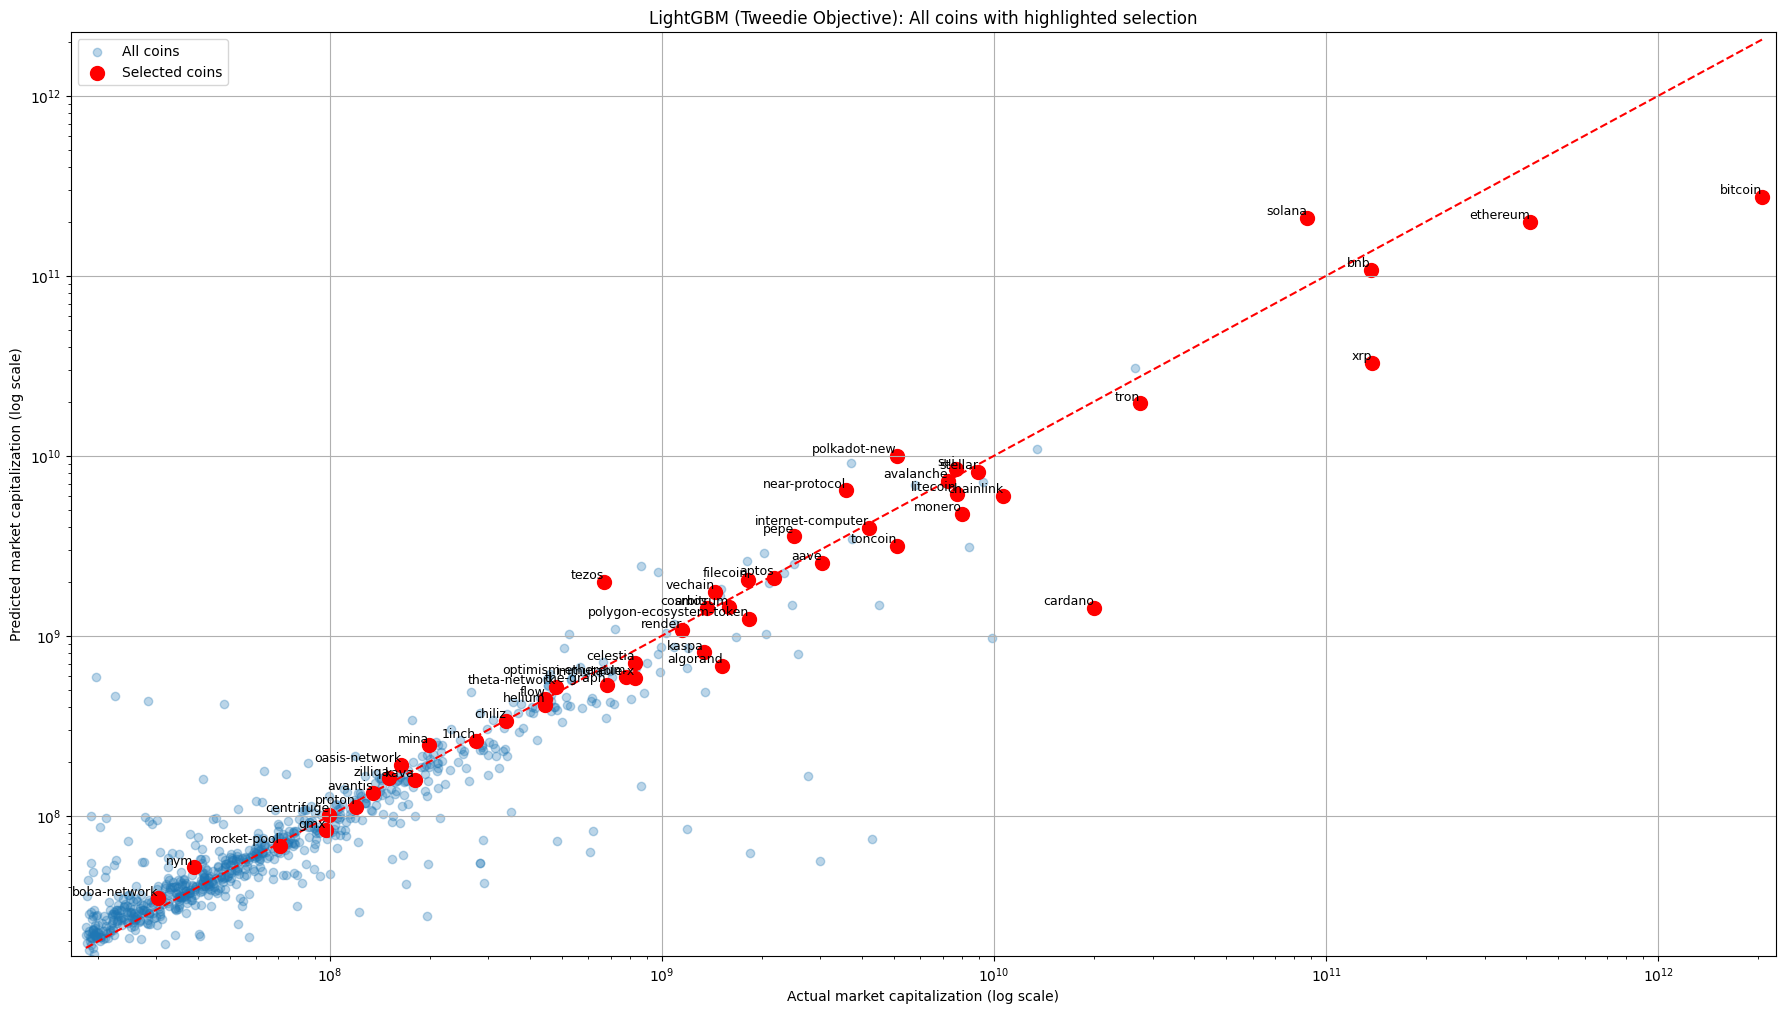
4.2 LightGBM (Tweedie Objective)
Test metrics (log10 target): R² = 0.4864; RMSE = 0.4706. Cross-validation: 5-fold CV R² = 0.4736 ± 0.0922.
Predictor correlations with log10_cap: twitter_score = 0.5008; log_watchlist_count_num = 0.4982; log_hypestat_visitors_num = 0.3296; log_hypestat_impressions_num = 0.3182; log_FollowAction_num = 0.2262; log_trading_volume_num = 0.1107; log_telegram_subscribers_num = -0.0644.
5. Use Case: Ranking Undervalued Assets
We operationalize a valuation-gap ranking: Gap = log10(predicted_cap) - log10(actual_cap). A positive Gap flags potential undervaluation—engagement breadth suggests a higher fair cap than observed. We screen the top decile by Gap with liquidity and venue filters, then perform qualitative diligence (engagement quality, organic growth, developer activity, and on-chain usage) before position sizing. This pipeline guides portfolio rebalancing toward engagement-rich, capitalization-light assets.
6. Limitations
Static snapshot bias: slow-decaying social metrics can mislabel “zombie” projects as undervalued after price collapse. Bot or inorganic engagement inflates Telegram and sometimes Twitter. Social breadth is not utility—missing fundamentals can cause misreads. Finally, factor payoffs vary by regime; cross-sectional fits can drift during structural shifts.
7. Improvements and Related Research
We prioritize literature-backed extensions over simplistic heuristics:
• Value × Momentum Filters: require Gap > threshold and improving short-/mid-term momentum in price and engagement to reduce falling-knife risk.
• Survival / Project-Death Risk: a classifier (or survival model) using dev inactivity, breadth of liquidity, delist trends, and sustained negative flows to down-weight high attrition probability.
• On-Chain Fundamentals: incorporate weekly active addresses, transaction counts, fee revenue/TVL (for DeFi), and supply unlock schedules as state variables to anchor valuation to usage.
• Anomaly & pump-and-dump detection: Undervaluation signals are spoiled by market manipulation. A real-time pipeline that flags pump-and-dump schemes can be layered on top. Recent work demonstrates that combining social signals (e.g. Telegram message NLP) with market data can preemptively identify pumped coins. Embedding such anomaly detectors would prevent following fake hype.
• Temporal Forecasting: sequence models (rolling elastic nets, LSTM/Transformer encoders) to project cap drift 1–4 weeks forward and time entries around the value anchor. Recurrent neural networks are adept at extracting temporal patterns.
• Interpretability: SHAP per coin/date to attribute fair-cap estimates to concrete drivers for IC and risk governance.
8. Conclusion
A compact, transparent feature set—TwitterScore.io, watchlists, website traffic, volume, Telegram—explains roughly half of the cross-sectional variation in log10(market cap). The resulting valuation-gap signal is an efficient way to shortlist undervalued assets for deeper diligence and measured overweights. Known blind spots (zombie projects, bots, missing fundamentals) are precisely the focus of our roadmap—dynamic trends, survival risk, on-chain analytics, anomaly defenses, and interpretable diagnostics. We will continue to iterate with rigor to compound a robust quantitative edge in digital-asset selection.