Статьи

Social Metrics and Cryptocurrency Market Capitalization: A Panel-Data Study

Abstract

We examine whether publicly available social engagement metrics are associated with subsequent changes in cryptocurrency market capitalization. Using a panel of 809 coins across 91 daily snapshots (December 2025 – April 2026), we estimate two-way fixed effects models with entity-clustered standard errors. Cross-sectionally, social metrics correlate positively with market cap (Spearman ρ up to 0.45). At the market-aggregate level, changes in mean Watchlist Count and Follow Action co-move with total market capitalization (R2 up to 0.78 on the cleaned sample of 85 time periods, Newey-West SE). At the individual-coin level, the few statistically significant effects carry negative signs, consistent with a mean-reversion interpretation. Results are sensitive to specification, sub-period, and size segment. We conclude that simple social metrics provide limited and unstable predictive information at the coin level, while aggregate community attention co-moves with market direction.
Keywords: cryptocurrency, social media, panel data, fixed effects, market capitalization, community engagement

1. Introduction

Cryptocurrency valuation is often argued to be more sensitive to network adoption, community engagement, and investor attention than traditional equity markets. We examine a set of platform-specific engagement metrics—CoinMarketCap watchlist counts, social follow actions, Telegram subscribers, and Twitter engagement scores—alongside trading volume as a market control, in a panel-data framework that controls for both coin-level heterogeneity and common time shocks.

We test five hypotheses: (H1) social metric growth predicts market cap growth; (H2) some metrics are stronger predictors; (H3) effects are stronger for smaller coins; (H4) short-term dynamics are better captured; (H5) aggregate social metrics co-move with market direction. Our findings challenge the simple narrative that “more followers means higher prices” and reveal a more nuanced picture.

2. Data

Our dataset comprises 91 daily snapshots from CoinMarketCap between December 24, 2025 and April 12, 2026. After merging with a ticker-mapping file, the panel contains 54,227 coin-snapshot observations covering 809 unique cryptocurrencies. Market capitalization ranges from $12.5M to $405.3B (median $62.2M). We examine four social engagement metrics and one market-activity control:
Variable
Type
Coverage
Median
Spearman ρ
Watchlist Count
Social
100%
39,000
0.437
Follow Action
Social
95.3%
136,000
0.291
Twitter Score
Social
98.0%
86.6
0.281
Telegram Subscribers
Social
42.2%
12,835
0.178
Trading Volume
Control
82.8%
$13.8M
0.447

Table 1. Variables, coverage, medians, and cross-sectional Spearman rank correlations with log(market cap). All ρ significant at p<0.001. Telegram Subscribers has 58% missingness, limiting inference for this metric.

All variables except Twitter Score are log-transformed via log(1+x). Forward returns are log(mcapt+h) − log(mcapt ) for horizons h = 1..4. Metric changes are first differences of log-transformed values. Coins are classified into tercile-based size buckets (small, mid, large) within each snapshot.

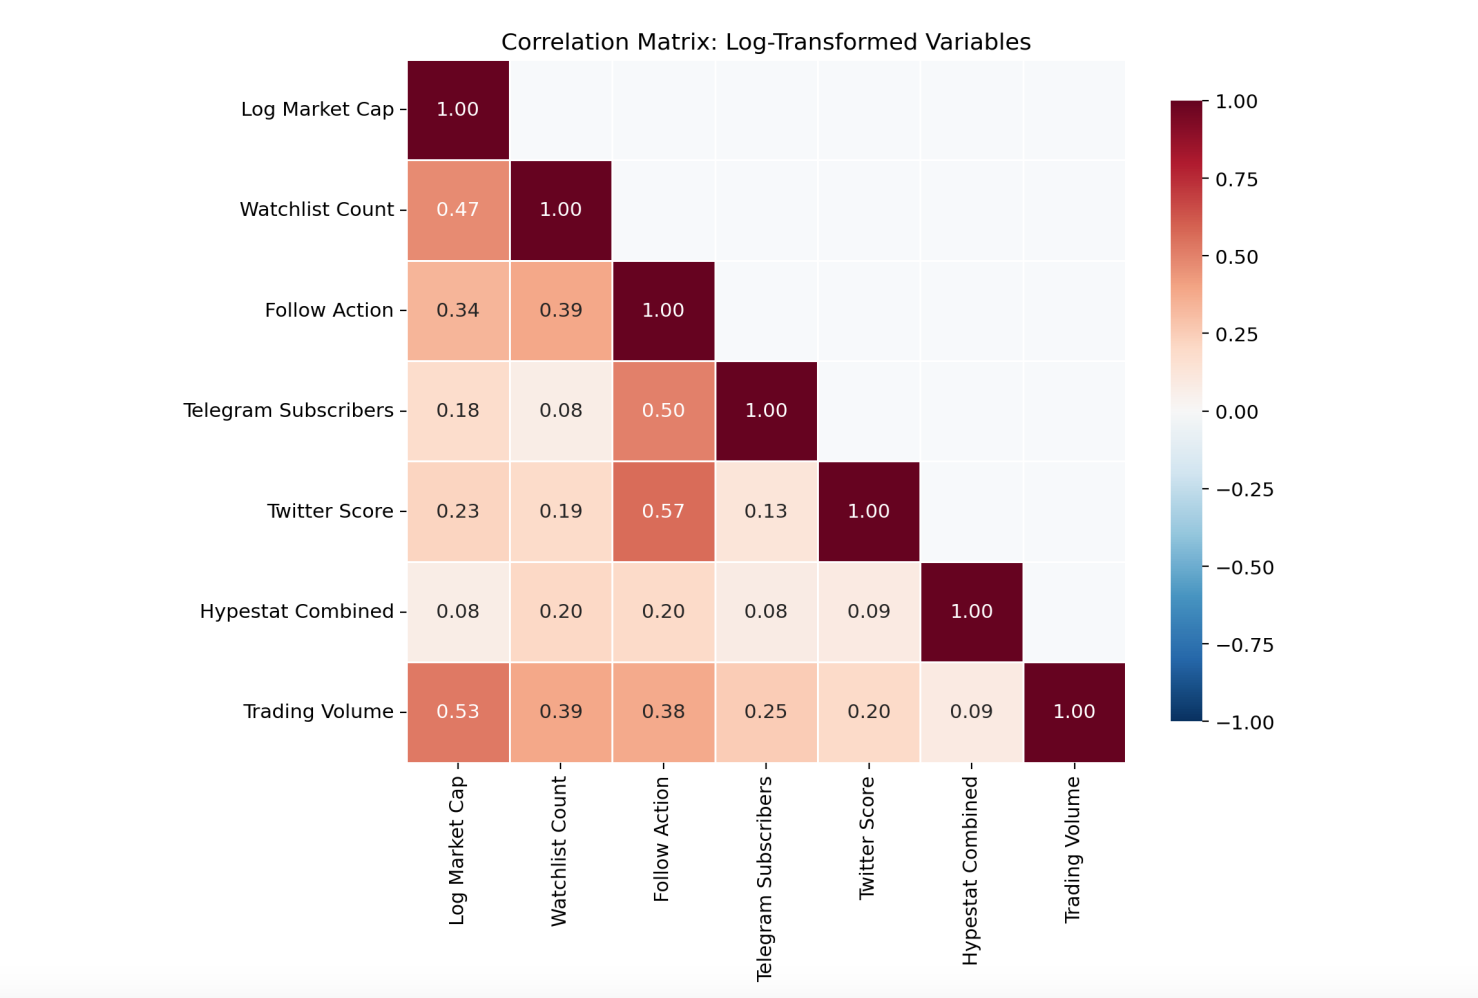
Figure 1. Pairwise correlations among log-transformed variables. Trading Volume and Watchlist Count show the strongest level-association with market capitalization.

3. Methodology

We use two model families. The baseline specification is a two-way fixed effects panel regression of forward log-returns on contemporaneous metric changes:

fwd_reti,t(h) = αi + γt + β · ∆log_metrici,t + εi,t


The lagged specification includes metric lags t−1 through t−4:

fwd_reti,t(h) = αi + γt + Σk=1..4 βk · ∆log_metrici,t−k + εi,t


where α i absorbs time-invariant coin characteristics and γ t absorbs common market shocks. Standard errors are clustered at the entity level. We use entity-level (rather than two-way) clustering because the number of time periods (T=91) is large relative to typical panel-FE applications, but we acknowledge that two-way clustering could be a stricter alternative.

We estimate both separate-metric and joint (all variables) models across horizons h=1..4. For market-level analysis (H5), we use OLS with Newey-West HAC standard errors (3 lags). Robustness checks: entity-FE only, time-FE only, winsorization (1st/99th percentile), excluding top-10 coins, and sub-period splits (first vs. second half).

4. Results

4.1 Panel-Level Results (H1, H2)
Table 2 reports separate-metric two-way FE results at h=1. Trading Volume achieves significance (p=0.003) but with a negative coefficient, consistent with a mean-reversion interpretation: volume spikes tend to precede weaker subsequent performance. Twitter Score is marginally significant (p=0.029) with a positive but economically negligible coefficient. Within-R2 is below 0.2% in all cases, indicating that social metric changes explain virtually none of the within-coin return variation after absorbing fixed effects. H1 is not supported at the panel level.
Metric
Coef
SE
t
p
R²■
Trading Volume
−0.0052
0.0018
−2.95
0.003
**
0.08%
Twitter Score
+0.000003
0.000002
+2.18
0.029
*
≈0%
Watchlist Count
−0.0381
0.0252
−1.51
0.130
0.12%
Follow Action
−0.0099
0.0112
−0.88
0.379
0.03%
Telegram Subs.
+0.0050
0.0069
+0.72
0.475
≈0%

Table 2. Separate-metric two-way FE regressions, h=1. Dependent variable: forward log-return. Entity-clustered SE. *** p<0.001, ** p<0.01, * p<0.05.

In joint models (all five variables simultaneously), no individual variable achieves significance at h=1. Twitter Score reaches marginal significance at h=2 (p=0.060). The joint within-R2 remains below 1%.
4.2 Horizon Decay (H4)

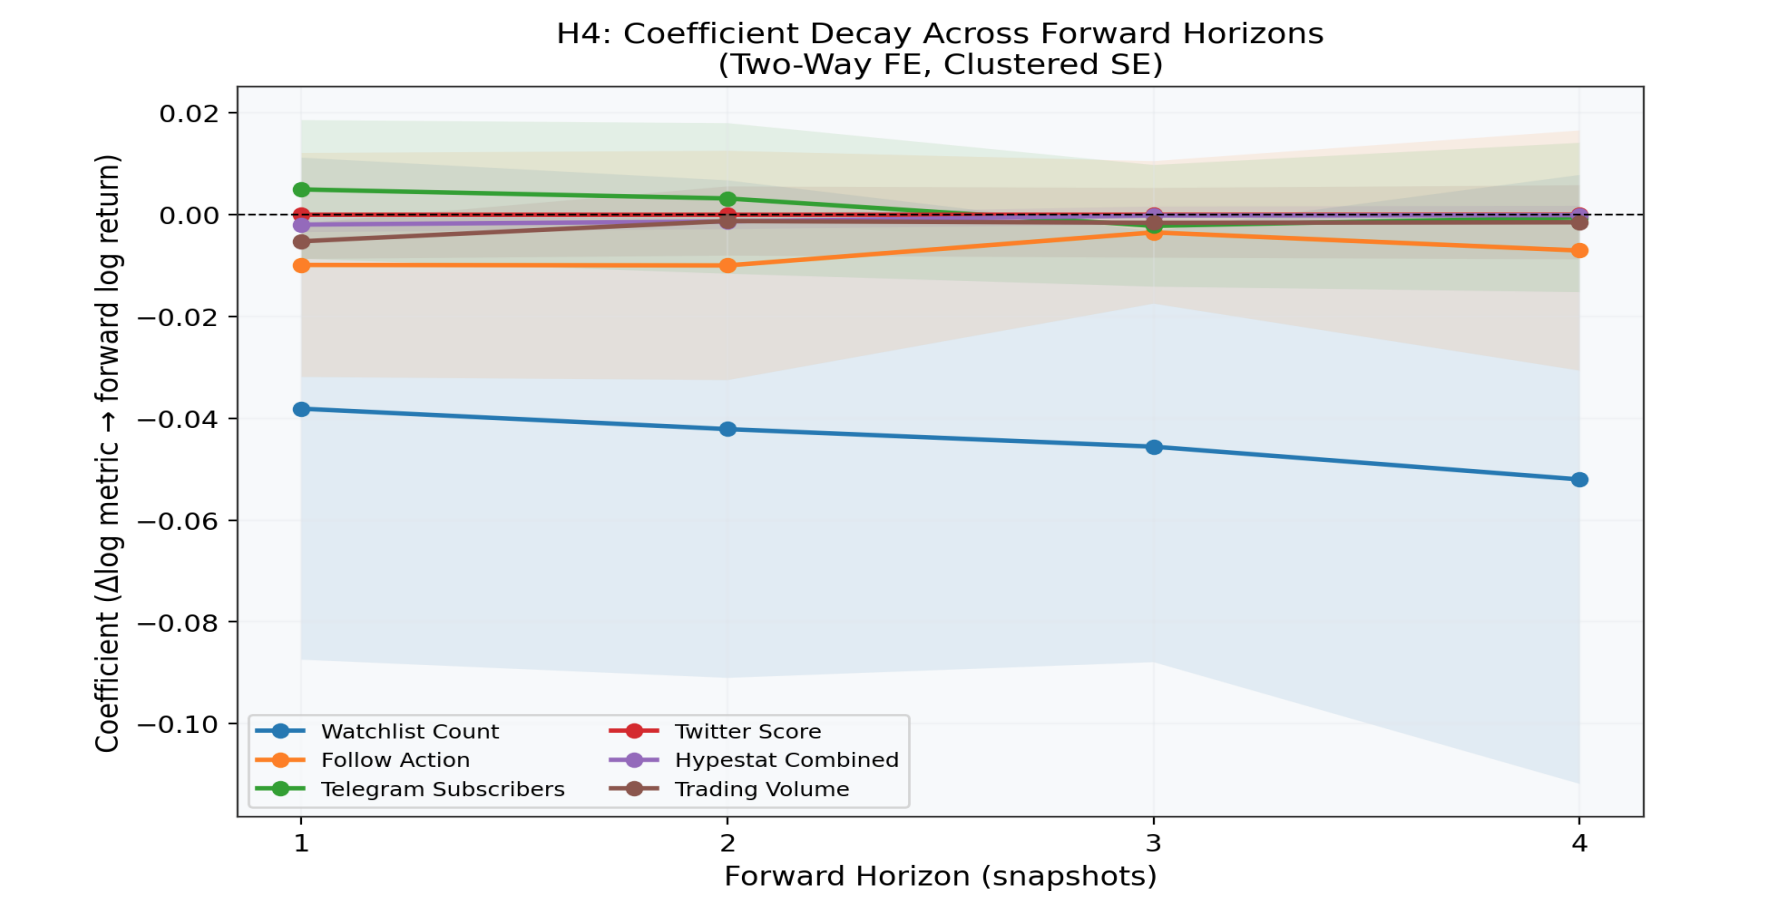
Figure 2. Coefficient estimates across h=1..4 (separate-metric models, 95% CI shaded). Effects dissipate beyond h=1 for Trading Volume. Watchlist Count shows a persistent negative pattern consistent with delayed reversal

Where significant effects exist, they are concentrated at h=1 and weaken at longer horizons, providing weak support for H4. Watchlist Count is an exception: its negative coefficient persists from h=1 through h=4, consistent with delayed reversal.
4.3 Size Heterogeneity (H3)
Bucket
Metric
Coef (h=1)
p
Coef (h=2)
p
Small
Watchlist Count
−0.025
0.399
−0.021
0.384
Small
Follow Action
−0.059
0.349
+0.043
0.338
Small
Telegram Subs.
+0.035
0.349
−0.009
0.643
Small
Twitter Score
−0.0001
0.467
−0.0001
0.369
Small
Trading Volume
−0.0004
0.862
−0.002
0.420
Mid
Telegram Subs.
−0.0045
0.010
**
+0.001
0.885
Mid
Follow Action
−0.026
0.092
+
−0.016
0.662
Mid
Trading Volume
−0.003
0.084
+
+0.032
0.359
Mid
Watchlist Count
+0.002
0.990
+0.151
0.557
Mid
Twitter Score
−0.0004
0.294
−0.001
0.090
+
Large
Follow Action
−0.409
0.063
+
−0.388
0.016
*
Large
Twitter Score
−0.0001
0.502
−0.0003
<0.001
***
Large
Watchlist Count
−0.158
0.364
−0.107
0.421
Large
Telegram Subs.
+0.037
0.157
−0.007
0.838
Large
Large Trading Volume
+0.006
0.511
−0.0002
0.973

Table 3. Size-bucket joint FE regressions. Full results for all metrics and both horizons. Significance: *** p<0.001, ** p<0.01, * p<0.05, + p<0.1.

H3 is not supported. Small-cap coins show no significant associations; this may reflect a power issue (noisier data, more erratic social metrics) rather than true absence of effect. Mid-cap coins show one of the clearer signals (Telegram p=0.010 at h=1). Large-cap coins exhibit significant negative effects for Follow Action (h=2, p=0.016) and Twitter Score (h=2, p<0.001).
4.4 Market-Aggregate Analysis (H5)
Five snapshots (t=59–63) were excluded from market-level analysis due to missing market capitalization data across all coins (likely a scraping failure). The remaining 85 time periods form the basis for Table 4.
Metric
Coef
SE (HAC)
p
N
Watchlist Count
4.93
0.77
<0.001
***
78.0%
85
Follow Action
5.94
0.91
<0.001
***
77.4%
85
Trading Volume
0.27
0.14
0.051
+
23.9%
85
Twitter Score
2.85
1.93
0.139
17.3%
85
Telegram Subs.
0.80
0.60
0.184
6.0%
85

Table 4. Market-level OLS: ∆log(total mcap) on ∆log(mean metric). Newey-West HAC SE (3 lags). 5 snapshots with missing mcap data excluded.

We find tentative support for H5. Changes in aggregate Watchlist Count and Follow Action are strongly associated with total market capitalization changes (R2 = 0.78 and 0.77 respectively, both p<0.001). The positive signs indicate that market-wide increases in community attention co-move with rising capitalization. However, causality cannot be established: both variables likely respond to common latent factors (news events, regulatory developments, BTC price movements). With 85 time-series observations, out-of-sample stability remains untested.

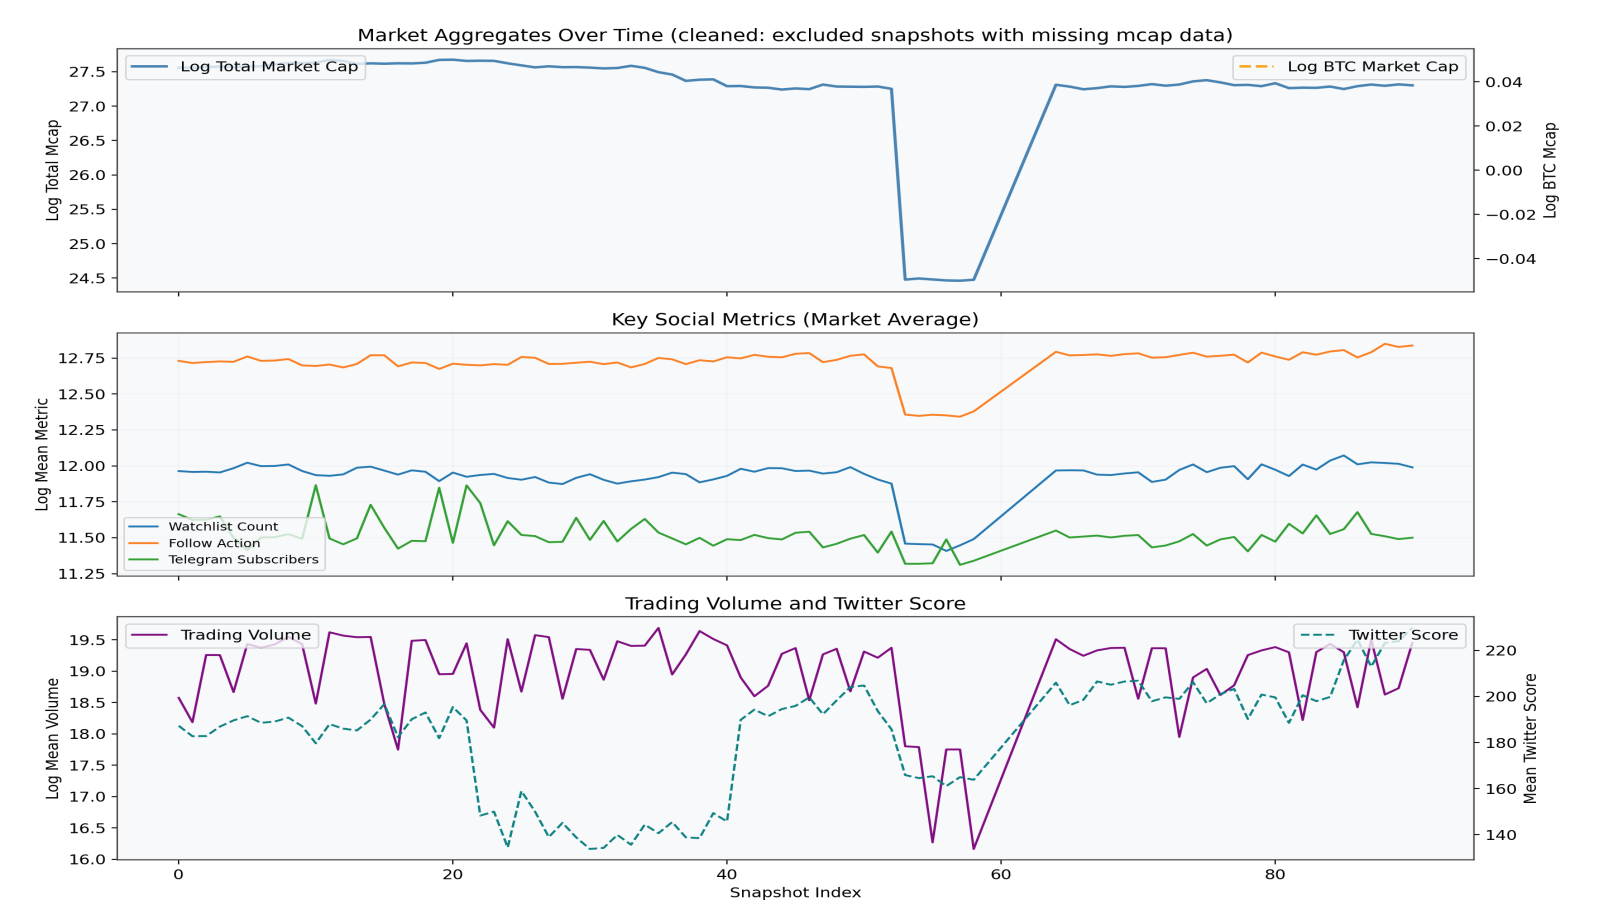
Figure 3. Market aggregates over time (5 broken snapshots excluded). Top: total and BTC market cap with regime shading. Middle: mean social metrics. Bottom: trading volume and Twitter Score.

4.5 Robustness
Results are sensitive to specification choices:
Specification
Key change vs. baseline
Entity FE only
Twitter Score significant (p=0.040)
Time FE only
Twitter Score marginal (p=0.060); similar to baseline
Winsorized (1/99%)
Follow Action becomes significant (p=0.014, negative)
Excl. top-10 coins
No substantive change
First half (Dec–Feb)
Twitter Score: p=0.0001 (highly significant)
Second half (Feb–Apr)
Twitter Score: p=0.233 (not significant)

Table 5. Robustness summary at h=1. The sub-period instability of Twitter Score (p=0.0001 vs. p=0.233) indicates that its baseline significance is driven by a specific market episode in the first half, not a stable structural relationship.

5. Discussion and Conclusions

This study yields three main findings. First, cross-sectionally, social metrics correlate positively with market capitalization (ρ up to 0.45), confirming that larger communities accompany larger coins—a strong descriptive relationship.
Second, at the individual-coin level, social metric changes have weak and unstable associations with forward returns. The few significant coefficients carry negative signs, consistent with a mean-reversion interpretation: in some specifications, attention spikes are followed by weaker subsequent performance. Within-R2 is below 0.2%, indicating that social metrics add virtually no predictive information after coin and time fixed effects.
Third, at the market-aggregate level, Watchlist Count and Follow Action are strongly associated with total market capitalization changes in this sample (R2 up to 0.78). This tentative finding requires replication on longer and independent samples before firm conclusions can be drawn.
The contrast between cross-sectional and within-coin results is informative. The cross-sectional relationship (more followers → higher cap) is absorbed by coin fixed effects. What remains is within-coin variation, where the evidence is more consistent with reversal than with persistent momentum, though the effect is weak and specification-dependent.
Several limitations apply. The 91-day sample covers a single market regime segment and may not generalize. Telegram data has 58% missingness. Social metrics and prices are jointly determined; without instruments or natural experiments, correlation does not imply causation. Daily frequency may miss intraday effects. Future work should employ higher-frequency data, sentiment analysis, and causal identification strategies.

Summary. Simple social engagement metrics provide limited and unstable predictive information for individual cryptocurrency returns. Aggregate community attention (Watchlist Count, Follow Action) co-moves with market-wide capitalization, but this association requires replication. The micro-level evidence is more consistent with reversal than with persistent momentum, though the effect is weak and specification-dependent.